Decline, depression, despair, depravity. Can the decline of the US, as a society and as a viable political entity, be measured and quantified? It's quite easily done, as it turns out. The amount of decline is inversely proportional to increases in certain commodities and functions.
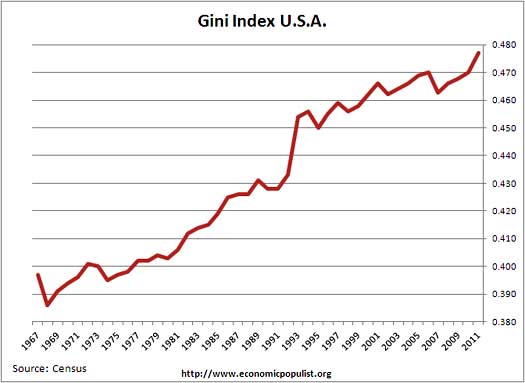
Take, for example, the rise in the Gini Coefficient, graphically pictured at the top. The Gini, named for the Italian statistician who figured it out, is an easy formula for identifying the amount of inequality in a country's income distribution. The higher, the number, the greater the inequality.
It works this way: in a society where everyone got the same amount of money, the Gini would be zero. The opposite, a society where one person got all the income and no one else got anything, would register a Gini of 1.0.
The US Gini has always been relatively high. In most of Scandinavia today it's below .3; in France it's about .33, and in England about .34. Our Gini of nearly .48 puts the US in a class by itself among the industrialized, "free" democracies of the west, and it's an extraordinarily skewed class, which appears to be getting steadily worse.

This obscene pile of squandered wealth is money not spent on things like school buildings and health care for US citizens. But if you want a clear window into the degree of depravity into which we've fallen as a society and a nation, you have to look at the incarceration figures.

Our growth industries today are weapons of war and mayhem, along with locking people up. This is a very sad and sorry representation of a country.
You can click on any of these charts to make them bigger and easier to read. Doing so will enable you to examine the critical turning point of the year 1980 in the second and third charts. In the first, 1969 appears to have been the critical year, and it's no exaggeration to say that the New Deal died in the rice paddies of Vietnam.
I don't blame Ronald Reagan entirely for the steep decline of the US since 1980, but I do feel his position in US history is analogous to that of the emperor Septimius Severus in Roman imperial history, he whom Edward Gibbon labeled "the principal author of the decline of the Roman Empire."
I don't actually enjoy coming across as a doomer pain in the ass, but unfortunately, the facts don't support any outlook except pessimism.
1 comment:
I've wondered about an alternate history branching off after an imaginary Carter reelection.
Post a Comment